What is Technical Analysis? 4 steps to learn Crypto Technical Analysis

What is Technical Analysis (TA)?
Technical analysis (TA) is a method of predicting future price movements of a security, based on past price movements. Technical analysts believe that all relevant information about a security is reflected in its price and that by analyzing price data, they can gain insights into the security’s future direction.
Technical analysis is widely used by traders and investors to make decisions about when to buy or sell a security. Many different techniques can be used for technical analysis, but some of the most popular include trend lines, support and resistance levels, moving averages, and oscillators.
Technical analysis can be applied to any kind of security, including stocks, bonds, commodities, and cryptocurrencies. In the cryptocurrency market, technical analysis is often used to predict future price movements of Bitcoin and other digital assets.
While technical analysis can be a useful tool, it is important to remember that it is not an exact science. Price movements are often driven by factors that cannot be predicted, such as news events or changes in the regulatory environment. As such, technical analysis should be used as one part of a broader investment strategy.
How does Technical Analysis work?
There are many different techniques that fall under the umbrella of technical analysis, but they all essentially boil down to trying to identify patterns in the price data that can be used to make predictions about what will happen next.
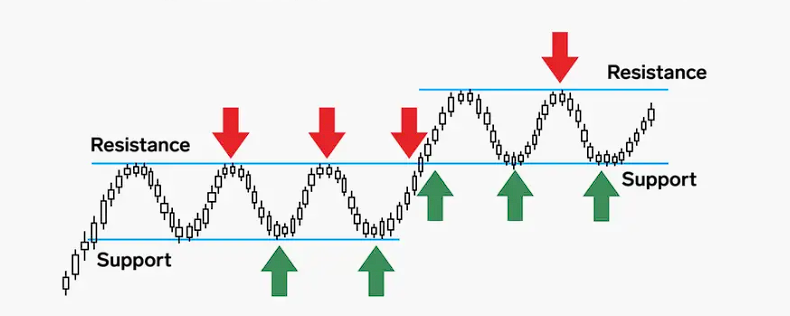
One popular technical analysis method is called support and resistance analysis. This technique looks at past price levels where the market has struggled to move past (resistance) or where it has found support and bounced back up from (support).
By identifying these key levels, traders can then watch for price action around these levels in the future and look to enter or exit trades accordingly.
Another common technical analysis technique is trend analysis. This approach attempts to identify whether a market is moving up, down, or sideways and then trade in that direction.
There are many different ways to measure trends, but one of the most popular is by using moving averages. Moving averages take the average price of a security over a given period of time and smooth out all the ups and downs to give you a clearer picture of which direction the market is actually moving.
Technical analysis can be used on any time frame, from very short-term charts lasting just a few minutes to long-term charts that track price action over years. It can also be used on any kind of security, from stocks and commodities to cryptocurrencies.
What is Technical Analysis used for in Crypto?
Technical analysis is widely used among traders and investors for making decisions about when to buy or sell a financial asset. Many individuals who trade stocks, bonds, and other securities use technical analysis to identify potential opportunities and assess risk.
There are many different techniques that can be used in technical analysis. Some common methods include:
- Identifying support and resistance levels.
- Analyzing price patterns.
- Using moving averages.
- Using technical indicators.
Each technique can be used to identify different types of information about the market.
For example:
- Support and resistance levels can help traders identify potential entry and exit points for their trades.
- Price patterns can provide information about the direction of the market while moving averages can help smooth out short-term fluctuations and provide a clearer picture of the underlying trend.
Technical indicators can give traders an idea of whether the market is overbought or oversold, which can be helpful in making decisions about when to buy or sell.
Fundamental analysis vs Technical analysis
Fundamental analysis and technical analysis are two different methods of analyzing the markets. Fundamental analysis looks at the underlying factors that can affect the price of a security, while technical analysis uses historical price data to identify patterns and trends.
Fundamental analysis is concerned with why prices move, while technical analysis is only concerned with what prices are doing. Technical analysts believe that all relevant information is already reflected in the price, so there is no need to look at anything else.
Technical analysis is a much more short-term approach than fundamental analysis. It is generally used to identify trading opportunities in the market by looking for patterns in price data. Fundamental analysis, on the other hand, is a long-term approach that is used to identify investments that are undervalued or expected to appreciate in value over time.
Different investors will use different combinations of fundamental and technical analysis to make decisions. Some may rely solely on one or the other, while others may use both methods together. There is no right or wrong way to approach the markets, and each method has its own strengths and weaknesses.
Differences between Crypto TA vs. Traditional TA
Crypto technical analysis and traditional technical analysis may appear to be very similar at first glance, but there are actually some major differences between the two.
For one, crypto technical analysis takes into account the unique features of cryptocurrencies, such as their decentralized nature and high volatility. Traditional technical analysis, on the other hand, is primarily designed for analyzing stocks and other financial assets that trade on centralized exchanges.
Another key difference is that crypto technical analysts often place greater emphasis on chart patterns and indicators that are specific to the cryptocurrency market. This is because these patterns and indicators can provide valuable insights into the underlying trends in the market.
Finally, crypto technical analysis also takes into account news and events that could impact the price of cryptocurrencies. This is important because news and events can have a major impact on the price of cryptocurrencies, which is something that traditional technical analysis does not account for.
In conclusion, crypto technical analysis and traditional technical analysis are two very different approaches to analyzing the financial markets. However, both approaches can be used to generate valuable insights into the market. It is up to the individual trader to decide which approach is best suited for their trading style and needs.
4 steps to learn Technical Analysis
Technical analysis is the study of past price patterns to identify market trends and forecast future prices. Technical analysts believe that the collective actions of all participants in the market, including buying and selling pressure, influence price movements.
There are four common steps to learning technical analysis:
- Familiarize yourself with chart types and technical indicators.
- Identify market trends.
- Identify support and resistance levels.
- Develop a trading strategy.
Let's take a closer look at each of these steps.
Step 1. Familiarize yourself with chart types and technical indicators
The first step in learning technical analysis is to familiarize yourself with different types of charts and technical indicators. Charts are used to visualize price data, and technical indicators are mathematical tools that can be used to identify market trends.
There are three main types of charts:
- Line charts plot the price of an asset over time.
- Bar charts plot the price of an asset at specific intervals.
- Candlestick charts provide more information than line and bar charts, including the opening and closing price, as well as the high and low price for a specific period.
Technical indicators are mathematical formulas that use historical price data to generate buy or sell signals. There are hundreds of different technical indicators, but some of the most popular include Moving Averages, Bollinger Bands, and Relative Strength Index (RSI).
Step 2. Identify market trends
The second step in learning technical analysis is to identify market trends. A market trend is simply the overall direction of the market. Trends can be bullish (upward), bearish (downward), or sideways.
One of the simplest ways to identify a market trend is to use a moving average. A moving average is simply the average price of an asset over a specific period of time. The most common periods are 20, 50, and 200 days.
If the price of an asset is above its 200-day moving average, it is in an uptrend. If the price is below its 200-day moving average, it is in a downtrend. And if the price is range-bound, it is said to be in a sideways trend.
Step 3. Identify support and resistance levels
The third step in learning technical analysis is to identify support and resistance levels. Support and resistance levels are price levels that the market has difficulty breaking through.
Support levels are typically below the current market price, while resistance levels are typically above the current market price.
Step 4. Develop a trading strategy
The fourth and final step in learning technical analysis is to develop a trading strategy. A trading strategy is a set of rules that you use to make buy or sell decisions. There are dozens of different trading strategies, but some of the most popular include trend following, mean reversion, and breakout trading.
There are many different trading strategies that technical analysis can be used. Some common ones are:
- Support and Resistance Trading: This strategy is based on the idea of finding areas where the price is likely to either bounce back up (support) or drop-down (resistance). Traders will then look to enter into positions when the price reaches these levels.
- Trend Following: This strategy involves following the overall direction of the market. Traders will look to buy assets that are trending upwards and sell assets that are trending downwards.
- Channel Trading: This strategy makes use of price channels, which basically range that the price moves within over time. Traders will look to buy at the lower end of the channel and sell at the upper end.
- Candlestick Reversal Patterns: These are specific candlestick patterns that can signal a potential reversal in the market. Tra positions when these patterns emerge.
When developing a trading strategy, it is important to consider your risk tolerance and investment goals. You should also backtest your strategy to see how it would have performed in the past.
Best tools & resources for Crypto Technical Analysis
Tradingview
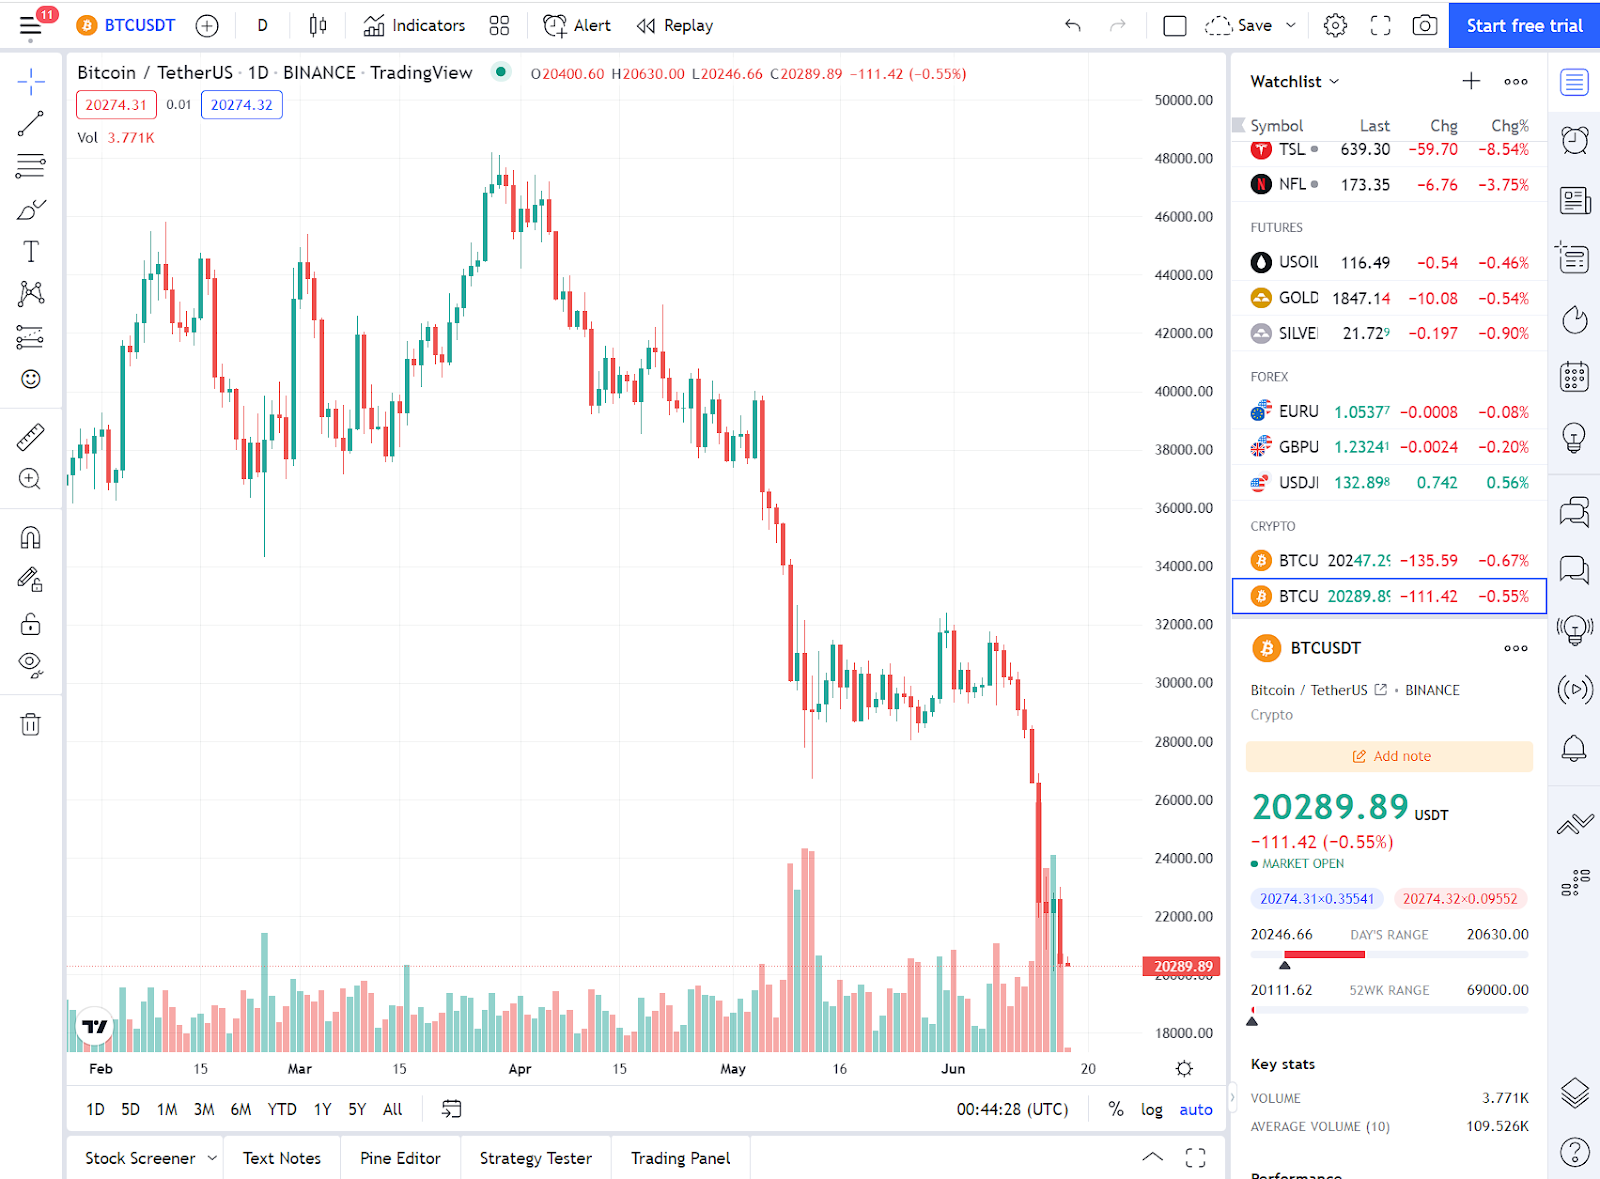
There are a number of different ways to learn technical analysis, but one of the best is through TradingView. TradingView is a website that offers users a range of different tools and resources to help them improve their trading skills. The site includes a range of tutorials, articles, and videos all focused on helping users learn about technical analysis.
One of the great things about TradingView is that it is designed for both beginner and experienced traders. The site includes a range of resources to help users get started, including a beginner’s guide to technical analysis. Once users have a basic understanding of the concepts, they can move on to more advanced topics such as identifying chart patterns and using technical indicators.
There is also a strong community element to TradingView. Users can interact with other traders and share ideas and strategies. The site also has a number of experts who offer their insights and analysis on a range of market topics.
Overall, TradingView is one of the best options for users to learn technical analysis. The site offers a wealth of resources and is constantly adding new content. It is also a great community for traders to connect with each other and share ideas.
Learn more: How to use TradingView
Dextools

Similar to TradingView, Dextools is one of the most popular web-based charting platforms and scanners for learning technical analysis. The platform is packed with features and resources that can help newbies and experienced traders alike to improve their skills.
For example, Dextools offers a variety of built-in scans that can be used to identify potential trading opportunities in real-time. In addition, the platform also provides access to a huge library of educational resources that can be used to further enhance one's knowledge of technical analysis.
Overall, Dextools is an excellent option for anyone looking to learn more about technical analysis and improve their trading skills.
Technical Analysis FAQs
Why is Technical Analysis important?
Technical analysis is important because it can give you an edge in the market. It can help you find trading opportunities that you might not see with your naked eye.
One of the benefits of technical analysis is that it can help you spot trading opportunities that you might not see with your naked eye. For example, a cryptocurrency might be trading at $50 per token, but a technical indicator might show that it's actually undervalued and poised for a rally. That's the power of technical analysis.
There is so much more to technical analysis than just using indicators, however. You also have to understand things like support and resistance, trend lines, and chart patterns. These concepts are essential for any trader who wants to use technical analysis to find trading opportunities.
Is Technical Analysis enough for trading?
No, technical analysis is not enough for trading. In order to be a successful trader, you need to have a complete understanding of the market and all of the factors that can influence it. Technical analysis can give you a good idea of where the market is headed, but it cannot tell you everything you need to know.
Cryptocurrency is a highly volatile market, there are more things you should consider, such as news, project development, communities' activity, etc.
Only when you have a comprehensive understanding of the market, can you make informed and profitable trading decisions?
Which is the best Technical Analysis indicator?
There's no definitive answer to this question since different traders have different preferences. Some popular technical analysis indicators include moving averages, MACD, RSI, and Bollinger Bands.
It really depends on what you're looking for in an indicator and what kind of trading strategy you're using. Ultimately, it's important to experiment with different indicators and find which ones work best for you.
Also available in
Vie